Operations & Analytics Dashboard
The admin back office we build for every platform, available on its own: one screen for the numbers, the queues, and the records your team edits all day.
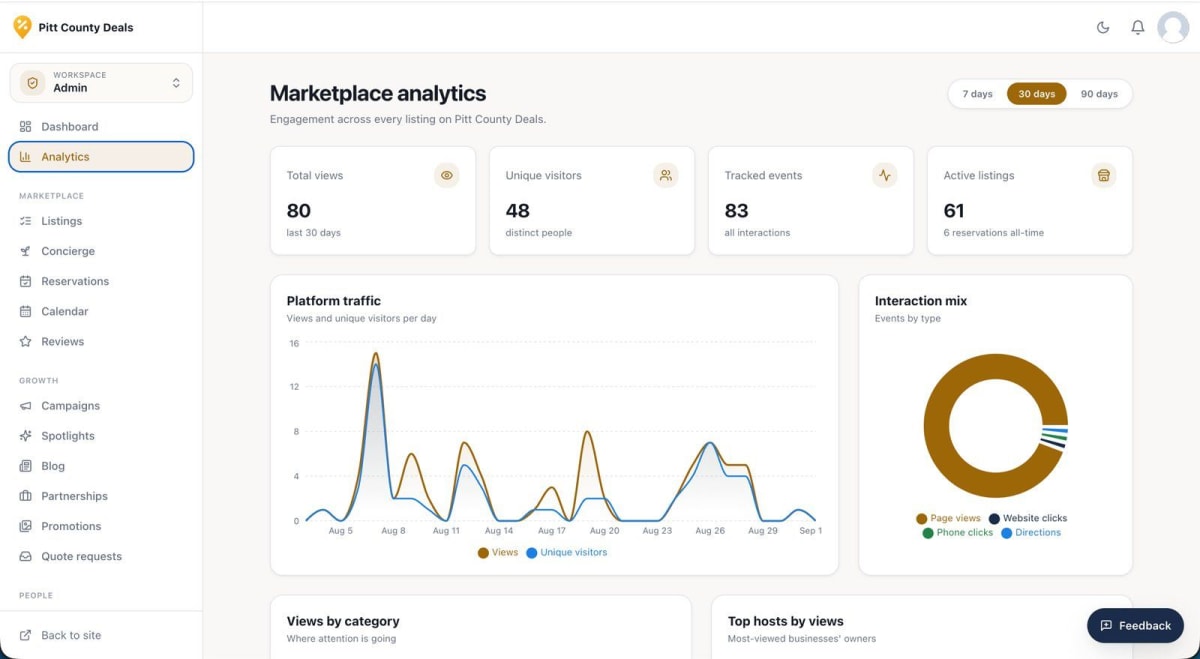
Overview
Most businesses do not need another reporting tool. They need one place where the numbers, the queue of things waiting on someone, and the records themselves all live together, so a question turns into an action without opening a second tab.
This is the dashboard layer we build behind every platform we ship, packaged and tailored to your data. The screenshot is the real thing: the administrative console behind Pitt County Deals, with traffic, engagement, interaction breakdown, and the operational queues beside them.
What it gives you
A metrics view over whatever you already record, whether that is traffic, orders, bookings, tickets or revenue, with the ranges and comparisons your team actually asks for rather than a fixed set someone chose once. Underneath it, full CRUD over your records, so the dashboard is where work happens instead of where work is described.
Where the data comes from
Your existing database, your existing APIs, or both. We do not require you to move anything: the usual arrangement is a read layer over what you have, plus write access to the specific records the team needs to change. Where there is no single source yet, the pipeline to create one is quoted as part of the work.
How it is customised
Your branding, your metrics, your roles. Which numbers appear, who may see each one, which queues exist, and what an admin may edit are all decided with you. Those decisions ARE the product, and a dashboard configured from someone else's assumptions is the one nobody opens twice.
What it is not
It is not a BI tool, and where Metabase or Looker would answer your question we will say so and help you set one up instead. This earns its cost when the people reading the numbers are the same people who have to act on them.
What's included
- Metrics overview with day, month and quarter ranges and period comparison
- Time-series and breakdown charts driven by your own event and record data
- Operational queues for approvals, requests and exceptions, with the action on the same screen
- Full record management with role-based permissions and an audit trail
- Segment and cohort views: by category, by owner, by location, by whatever you sort on
- Scheduled email digests, so the numbers arrive without anyone logging in
- CSV and scheduled exports for the finance and reporting workflows that need them
- Your branding, your domain, and single sign-on against your existing identity provider
What is the most expensive thing your team still does by hand?
Tell us, and we'll tell you honestly whether software can fix it, and roughly what it would cost. No pitch deck.